Ensuring IT networks have true visibility to performance
All too often we have conversations with organisations that say that their current toolset provides them with what they need. However, invariably we have follow up discussions around untraceable performance degradation or lost packets for unknown reasons and then try to help with back-in-time analysis of data that isn’t seen.
These cases always point to lack of granular information. It can be as simple as a packet capture not being able to discern a micro-burst or flow / SNMP data that is based on 5 minute or 1 minute intervals.
In a 1Gbps network link, based on an internet average packet size of around 700 Bytes, there are around 178,600 packets every second. So how is 1 minute sampling or even 1s sampling going to possibly assist with understanding what the network is really doing?

Instrumentation granularity is the key!
It’s not a case of spending hundreds and thousands of dollars to put together a complete turnkey monitoring system at times, but doing things smartly around those links or network segments that are most important and can cause the most pain.
However, nothing is free when it comes to reliable and granular solutions and even a great engineer with Wireshark and flow / SNMP data will struggle to find milli-second problems and packet loss on a busy network.

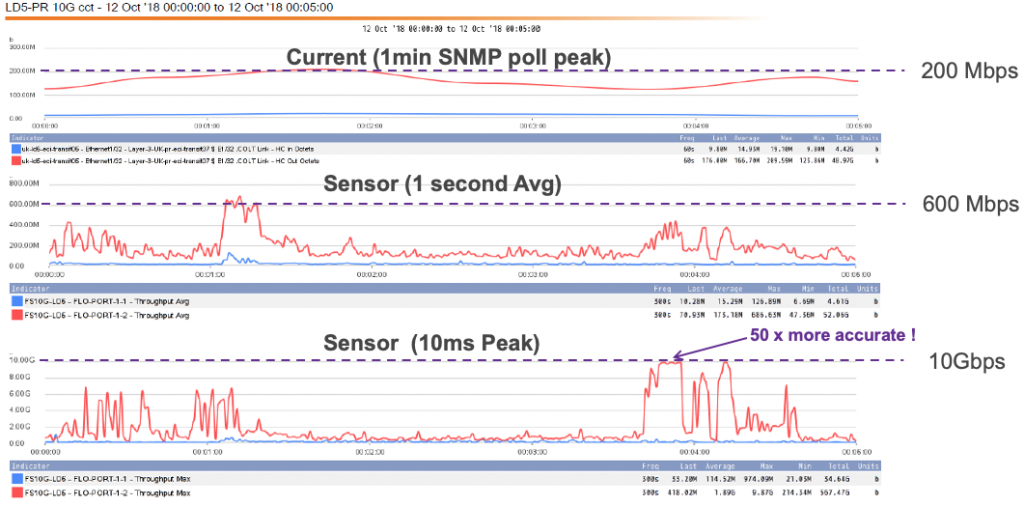
In the example above the client is experiencing dropped traffic but how could that be when their SNMP polling is showing only 200Mbps over their 10G link. Additionally, they are taking ad-hoc packet captures using Wireshark on a laptop so surely that is getting everything too?
Well, actually no, not even close.
Added to this that even with a 1Gbps laptop NIC (the client is assuming less than 1Gbps performance from the data above) they perform around 600Mbps at best. So even captured data is highly unreliable. Again, not even close.
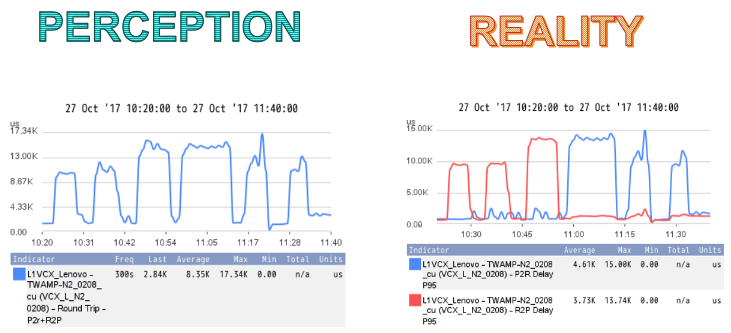
SNMP is averaging out every 1 minute, so the 10G plus traffic spikes are not even registering. On the off chance the client have got some other probes with 1s resolution they’re seeing maybe a little more traffic. However unless they’re monitoring with milli-second granularity then the real story is completely hidden – Perception IS NOT Reality.
They turn to their switch or edge router in this case to get the ‘reliable data’ because these devices can see everything. Unfortunately their throughput monitoring capabilities are not that granular either, so they’re seeing similar types of data but also seeing lost packets, and then they’re also trying to figure out is it upstream or downstream we’re seeing the problem.

All these problems, that should be seemingly easy to investigate become extremely difficult without the granularity to help.
There are good tools out there that can do line-rate packet capture up to 200Gbps but can get quite pricey (such as our solution from Synesis – www.synesis.tech/en/). But for monitoring multiple links there are more cost effective solutions that really help with understanding a network, and a lot of time actually capturing the traffic is not always required, but understanding how a network pushes traffic around is. Thus the ability to monitor both passively and actively can be a real bonus.
Accedian (www.accedian.com) is in a unique position to help with these types of problems. And in line with our recent blog posts the key to these solutions is that they are very affordable to most enterprise, government or educational organisations.
The key aspects to what Accedian does, and what should be readily available to any network engineer or management team, are:
- Verify layer 3 performance for a given destination IP
- Precisely monitor per-flow & port level stats
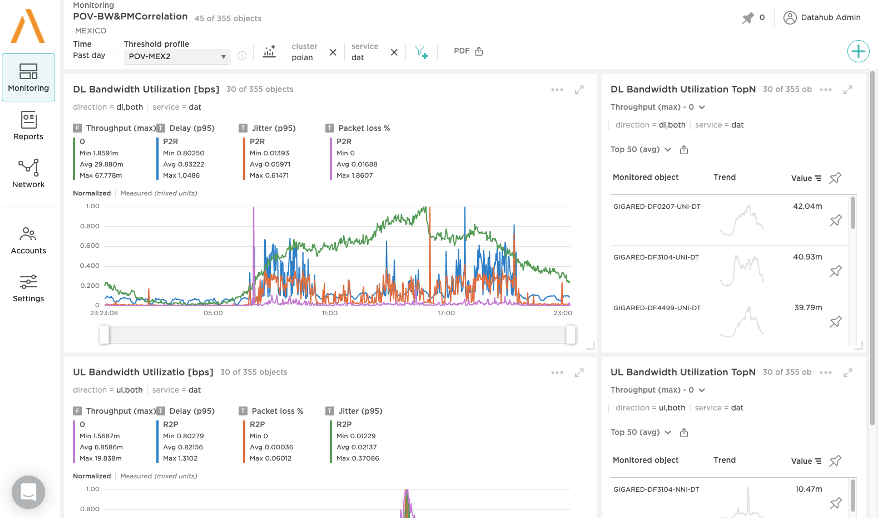
- Packets received, bandwidth, % utilization reported by Skylight sensor type in real time
- The most precise active bandwidth measurement available on the market up to 1ms using TWAMP
- Active testing of latency, jitter and packet loss


Leave a Reply